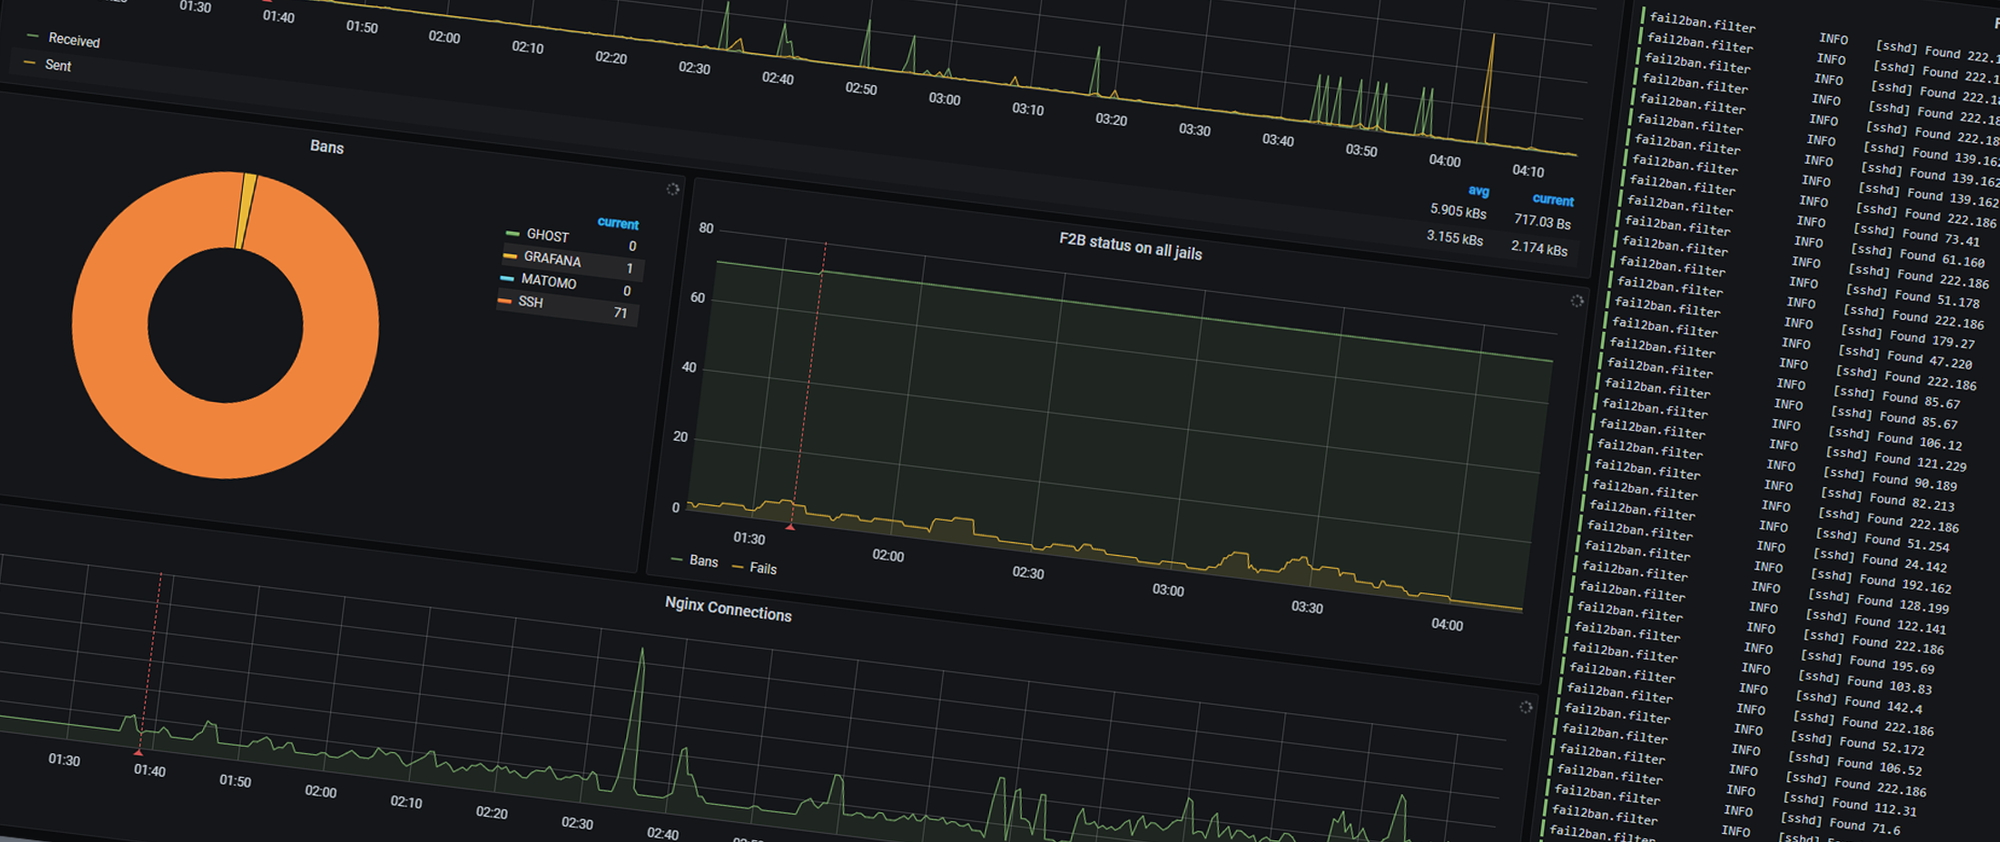
Now that I have set up this server as I want, the next step is to ensure it stays this way. One of the things I do to achieve this, is by setting up monitoring, and yes, it is very overkill for this setup. I went with a set of tools that I know, with some new additions which has been on my list of things to look into for a while, mainly Loki and Promtail. They are both projects from Grafana which are heavily focused on logs, both presenting them and parse them.
I’m basing this on the TIG(Telegraf, InfluxDB, Grafana) stack, because I didn’t want to spend time learning Prometheus, however implementing this took more time than it should’ve, Loki even got updated while setting it up. As I said earlier, I wanted to add some new tools in my “normal” stack. Just because Telegraf can do logs, does not mean it should. It can handle both syslog with a syslog-listener plugin, and docker-logs with the use of the docker socket, but Grafana has no good way of presenting them (I don’t blame them).
Setting up InfluxDB
Setting up InfluxDB in docker is quite easy. This is all it takes.
| |
Setting up Telegraf
Again, I choose to have a service running on the host, rather than in a container. I did this because Fail2Ban run on the host, having a container talking to a service on the host when the Telegraf plugin uses the command-line to interface with the service sounded like an unnecessary challenge.
My telegraf.conf is relatively small, only because I added the sections I were going to use, rather than using the one included which has all the options in it. Depending on your experience with Telegraf, it might look a bit complicated, especially the outputs. It is in fact not that advanced.
| |
This is mainly doing two things, to achieve the goal of diverting each type of metric into their own database in InfluxDB. Having them all in the same one isn’t really a problem; it just makes it easier for me. To do this Telegraf has to add a tag to the metric it collects.
| |
Here I tell Telegraf to tag all the metrics from the cpu input with the tag influx_database set to system. Telegraf can use the tagpass and tagdrop to further filter the metrics. We use tagpass to tell Telegraf which tags this output should allow. In the example I tell it to allow all metrics tagged with influx_database set to system. The tagdrop does the opposite, it tells Telegraf which tags it should not allow. In order to keep the output somewhat clean, I tell Telegraf to not pass the influx_database tag to InfluxDB.
Other than configuring nginx to show nginx_stub status on 127.0.0.1:8080, the rest of the telegraf.conf is pretty much stock.
| |
Setting up Grafana
I noticed a while back, that you can configure Grafana purely by using enviroment variables, this is awesome because it can also be set up to not use the embedded sqlite database. Which means I don’t need to give it a volume mount for persistent data, I did however give it a mount for using the socket instead of using http between nginx and Grafana.
| |
I renamed the default organization in Grafana, which means that the default anonymous(guest) access break. I fix that by declaring which organization and role the anonymous user is attached to. Then I tell Grafana how to connect to the database, and what plugins it should install on start. Since I can, I also set the admin username and password, instead of updating the user after the fact.
Unlike Ghost, Grafana doesnt have a way to set permissions on the socket. Therefore, Grafana runs as my user, as part of the www-data group. It is dirty, but it works.
Reading a simple logfile with Promtail
The next part was getting Loki and Promtail set up. Oh boy what a task this was. I don’t know why, but there isn’t much content about this out there, if I were to guess people run the whole ELK stack. Which is way overkill for what I want to achieve here. The biggest hurdle personally was the fact that it was written in go, and therefore the config used some go-specific rules. Did you know that go’s implementation of regex is very minimal? Or that the time-formatting is done without the notion of deliminators like YYYY-MM-DD? I for sure did not.
Getting the containers running was pretty simple, once you have downloaded the basic configuration files for Loki and Promtail. I choice to not use the default location inside the containers, I followed the practice of having all persistent data inn /config since I can override the config.file location with the command feature of docker.
| |
My Loki service is not too far off from the example Loki provides. I added the hostname for the machine and set the TZ. I will come back to the logging part later.
For Promtail I gave it two volume-mounts for logs, where /opt/logs is where the logs from the applications I run with Docker are located (not to be confused with docker logs). The next thing I did was to change the promtail-config.yaml file to tell Promtail to read the logs in /opt.
| |
I could have added the __path__ to the varlogs job, but I added it as a new job to be able to filter it out easily in Grafana. They would present themselves something like this:
As well as labeling the data with the job-name, it also labels it with the filename, which is neat when you want to focus on a specific logfile. If you look closely you can see that Loki didn’t read the timestamp properly. This is something we can fix manually and depending on the original time-format its not that difficult, after getting over the hurdles that is go’s time-formatting. The documentation does cover it, but it takes a few clicks to get there, so here is a link. There is a catch here though, especially if you know language like python. go’s time-formater doesn’t handle milliseconds with commas, there is an issue open about this from 2013.
2021 Note: Looks like this is no longer the case
You can still get the timestamp, but there is an additional step that need to be taken for that. I ran into that issue with the fail2ban logs, and I will walk you trough how I solved it. Here is a line from that log.
2020-05-27 21:51:50,138 fail2ban.filter [9474]: INFO [sshd] Found 1.1.1.1 - 2020-05-27 21:51:50
The first thing that had to be done was extracting the timestamp from the line. This is done with a regex stage. Note the that the backslashes needs to be escaped.
| |
I am also going to be extracting a few other things, like the message itself, the PID and the log-level, to use in other stages. You can look at the regex in action on regex101.com.
Now I can use the content of time group as a variable in Promtail. The next step is to replace the comma with a dot, so Promtail can understand the time-format. This is done with a template step. That is another thing worth looking into, go’s template system. After reading about the replace function on the string function, it was pretty clear that it was the last piece of the puzzle I needed to solve before putting it all together.
| |
Now we have the time variable available, because all the capture groups created with the regex step is exported for us to use. I pass it to the template. .Value is the value from the variable set as source. Then it replaces , with . for -1 times, -1 is the same as replace all. The output of this step is a new time variable, same name, new content. We can now define the timestamp in the next stage.
| |
This is how you define a time-format in GO. This is it. It is a clever way to do it, it uses a set value for each component. The year it looks for is 2006, so it’s either 06 or 2006. The month has a few more options 1, 01, Jan or January. So, in a sense it is all pretty easy to read. All the possibilities for the components are in the documentation for the timestamp stage.
Now Promtail know what time the log was sent for.
I am not happy with the result; it has data I don’t need, there is more I can do. If you look at the initial line from the log, it also has the time at the end, neither do I need the PID. I can fix this with another template step and a regex step.
| |
In this stage it reads the message extracted from the initial regex, then it replaces the content of the capture-group/label called pid with nothing.
| |
This regex step uses the message passed from the previous template step and creates a new message capture-group, the important thing here is that it places the eventual timestamp in its own capture group, which is not a part of the message group.
If I were to start Promtail now, it would still see the line as it is in the log. Promtail needs to be told what it should be passing along, so we use the output stage.
| |
However it also needs to be told what to apply all these steps to, so a final configuration to get Promtail to read and parse the Fail2Ban log would look something like this.
| |
In order for Promtail to know where to apply these stages, it needs to match it to something. Grafana is then again presenting a new concept with Loki, LogQL. It is an adaptation of Prometheus’ query language, focused on logs. This is used in the selector, I kept mine simple. It is only matching against filenames ending with fail2ban.log, the filename includes paths, which is why there is a wildcard in front.
Reading docker-logs with Promtail
Loki has a docker log-driver, which as the time of writing has a few deal breaking issues, mainly #2017. To work around this, I found that sending docker-logs to the journal works for my use case. The Promtail config for this was surprisingly easy, by just setting up the journal job example from Promtails documentation.
| |
That will give us the journal from the host since /var/log/journal is mapped.
There is a few ways to tell docker to log to the journal, however I am going to do it in my docker-compose. I simply just add a few lines to the containers I want to see in Grafana.
| |
My Matomo instance would then look something like this.
| |
Now I can see the logs from the Matomo container in Grafana, however it does not have a label I can use to sort out all the entries which does not come from the container. I can do that by adding a relabel action in the job-definition. Promtail presents all metadata from the journal with the __journal_ label-prefix. This means that we can access the CONTAINER_NAME attribute docker adds to the logfile with the label __journal_container_name, so by adding a relabel_config we can get the container name as a label in Promtail.
| |
It will present the logs similar to this: